Revenue from domestic transactions (including import of services) is also 13% higher Y-o-Y
Average gross monthly GST collection in FY 2023-24 now stands at ₹1.66 lakh crore; 11% higher Y-o-Y
Delhi, 01 NOV 2023
The gross GST revenue collected in the month of October, 2023 is ₹ 1,72,003 crore out of which ₹ 30,062 crore is CGST, ₹ 38,171 crore is SGST, ₹ 91,315 crore (including ₹ 42,127 crore collected on import of goods) is IGST and ₹ 12,456 crore (including ₹ 1,294 crore collected on import of goods) is cess.
The government has settled ₹ 42,873 crore to CGST and ₹ 36,614 crore to SGST from IGST. The total revenue of Centre and the States in the month of October, 2023 after regular settlement is ₹72,934 crore for CGST and ₹ 74,785 crore for SGST.
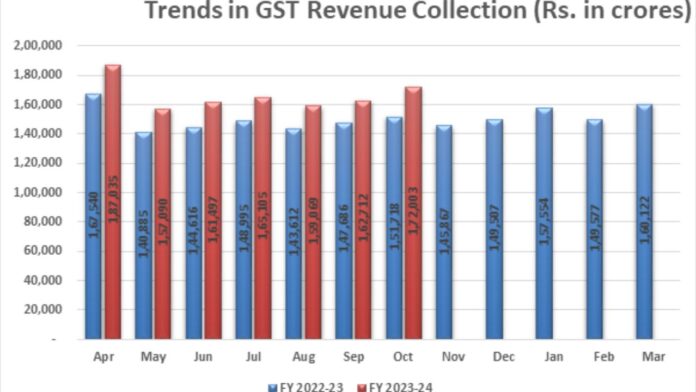
The gross GST revenue for the month of October, 2023 is 13% higher than that in the same month last year. During the month, revenue from domestic transactions (including import of services) is also 13% higher than the revenues from these sources during the same month last year. The average gross monthly GST collection in the FY 2023-24 now stands at Rs. 1.66 lakh crore and is 11% per cent more than that in the same period in the previous financial year.
The chart below shows trends in monthly gross GST revenues during the current year. The table below shows the state-wise figures of post settlement GST revenue of each State till the month of October 2023.
Chart: Trends in GST Collection
Table: SGST & SGST portion of IGST settled to States/UTs
April-October (Rs. in crore)
| Pre-Settlement SGST | Post-Settlement SGST[1] | |||||
| State/UT | 2022-23 | 2023-24 | Growth | 2022-23 | 2023-24 | Growth |
| Jammu and Kashmir | 1,318 | 1,762 | 34% | 4,299 | 4,817 | 12% |
| Himachal Pradesh | 1,341 | 1,546 | 15% | 3,368 | 3,302 | -2% |
| Punjab | 4,457 | 4,903 | 10% | 11,378 | 13,115 | 15% |
| Chandigarh | 351 | 389 | 11% | 1,227 | 1,342 | 9% |
| Uttarakhand | 2,805 | 3,139 | 12% | 4,513 | 4,890 | 8% |
| Haryana | 10,657 | 11,637 | 9% | 18,291 | 20,358 | 11% |
| Delhi | 8,000 | 9,064 | 13% | 16,796 | 18,598 | 11% |
| Rajasthan | 8,832 | 9,859 | 12% | 19,922 | 22,571 | 13% |
| Uttar Pradesh | 15,848 | 18,880 | 19% | 38,731 | 42,482 | 10% |
| Bihar | 4,110 | 4,731 | 15% | 13,768 | 15,173 | 10% |
| Sikkim | 179 | 297 | 66% | 489 | 629 | 29% |
| Arunachal Pradesh | 282 | 378 | 34% | 932 | 1,155 | 24% |
| Nagaland | 125 | 177 | 42% | 564 | 619 | 10% |
| Manipur | 166 | 210 | 27% | 812 | 659 | -19% |
| Mizoram | 105 | 168 | 60% | 488 | 573 | 18% |
| Tripura | 242 | 299 | 23% | 847 | 928 | 9% |
| Meghalaya | 265 | 353 | 33% | 841 | 988 | 17% |
| Assam | 2,987 | 3,428 | 15% | 7,237 | 8,470 | 17% |
| West Bengal | 12,682 | 13,799 | 9% | 22,998 | 24,607 | 7% |
| Jharkhand | 4,329 | 5,152 | 19% | 6,466 | 7,128 | 10% |
| Odisha | 8,265 | 9,374 | 13% | 11,031 | 12,723 | 15% |
| Chhattisgarh | 4,285 | 4,773 | 11% | 6,421 | 7,656 | 19% |
| Madhya Pradesh | 6,062 | 7,384 | 22% | 15,418 | 18,100 | 17% |
| Gujarat | 21,644 | 24,005 | 11% | 32,943 | 36,322 | 10% |
| Dadra and Nagar Haveli and Daman and Diu | 381 | 372 | -3% | 709 | 606 | -15% |
| Maharashtra | 48,870 | 58,057 | 19% | 74,612 | 84,712 | 14% |
| Karnataka | 20,165 | 23,400 | 16% | 37,924 | 42,657 | 12% |
| Goa | 1,111 | 1,307 | 18% | 2,024 | 2,299 | 14% |
| Lakshadweep | 6 | 16 | 162% | 18 | 66 | 259% |
| Kerala | 7,016 | 8,082 | 15% | 17,450 | 18,370 | 5% |
| Tamil Nadu | 20,836 | 23,661 | 14% | 34,334 | 37,476 | 9% |
| Puducherry | 271 | 288 | 6% | 695 | 833 | 20% |
| Andaman and Nicobar Islands | 112 | 125 | 12% | 287 | 311 | 8% |
| Telangana | 9,538 | 11,377 | 19% | 21,301 | 23,478 | 10% |
| Andhra Pradesh | 7,347 | 8,128 | 11% | 16,441 | 18,488 | 12% |
| Ladakh | 81 | 121 | 49% | 311 | 377 | 21% |
| Other Territory | 97 | 140 | 44% | 281 | 685 | 144% |
| Grand Total | 2,35,167 | 2,70,777 | 15% | 4,46,167 | 4,97,562 | 12% |

 हिंदी
हिंदी


